Neoplastic transformation, or the conversion of normal tissue into a malignant tumor, is a multi-step process. While its causes are diverse, and to a large extent remain unclear, aberrant intracellular signaling plays a role at every stage of tumorigenesis. IQGAPs are intracellular scaffold proteins which are central to the maintenance of normal cellular homeostasis. We and others have previously shown that changing IQGAP expression leads to deregulation of normal signaling, and that this deregulation has relevance to tumorigenesis. It has also been reported that IQGAP expression is altered in several neoplasms. Viewed collectively, these data support a role for IQGAPs in cancer.
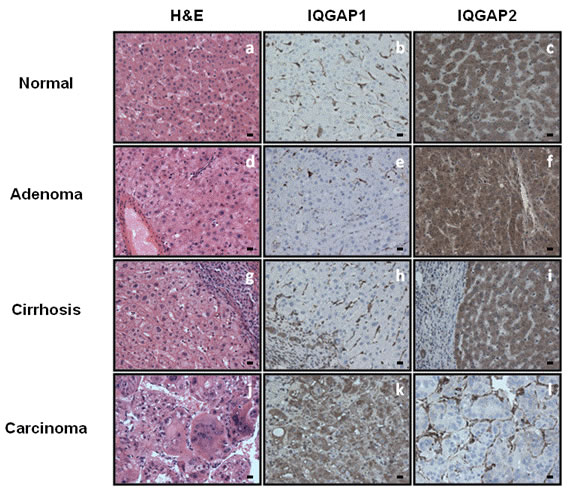
Overexpression of IQGAP1 has been reported in a wide variety of tumors. Conversely, IQGAP2 expression is frequently lost. These observations have led to the hypothesis that IQGAP1 is an oncogene, while IQGAP2 may represent a novel tumor suppressor. We are currently focused on the role(s) of IQGAPs in the pathogenesis of breast cancer and hepatocellular carcinoma (HCC). In these neoplasms, our initial data support this hypothesis. For example, in human HCC, IQGAP1 is overexpressed in the majority of HCC cases, but not in normal tissue, hepatic adenomas or cirrhotic livers. Conversely, IQGAP2 is expressed in normal tissue, hepatic adenomas and cirrhotic livers, but is often absent from HCC. We are currently elucidating the mechanism(s) by which IQGAP1 and IQGAP2 may regulate tumorigenesis in these cancers.